Worked example
What you get, on one page
A real diagnosis of an enterprise customer onboarding process, cut down to the essentials: what goes in, what comes out, and what it found.
What you put in
- •Your answers as we walk through the process together
- •Any documents, screenshots or spreadsheets you already have
- •What your customers say goes wrong (voice of the customer)
- •Your volumes, timings and costs, where you know them
What you get back
- •A current-state process map with swimlanes and wait times
- •The eight-dimension diagnostic scorecard, with evidence
- •Where time and money are wasted, sized in pounds
- •Ten prioritised improvements and a 30/60/90-day plan
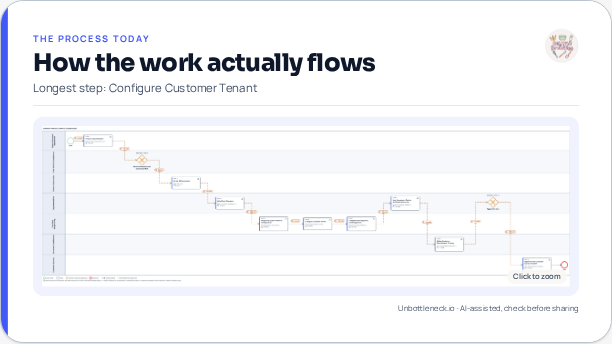
1. Your process, mapped
Swimlanes, steps and the waiting time between them, built from your answers.
2. Where the waste is
Waiting
Contracts sit 4.2 days on average awaiting legal sign-off.
Rework
1 in 3 onboarding packs returns for missing customer data.
Handoffs
Seven owner changes between sale and go-live.
Over-processing
The same details are re-keyed into three systems.
3. What customers said
“We were asked for the same information four separate times.”
“Nobody could tell us when we’d actually be live.”
“The first invoice was wrong because the setup data was wrong.”
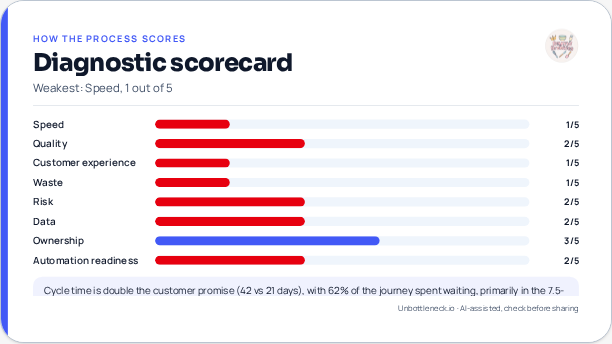
4. Scored against eight dimensions
Each score carries the evidence behind it, so you can challenge any of them.
5. The plan, in three moves
First 30 days
Single intake form, one named owner per account.
By 60 days
Parallel legal review, automated data hand-off to billing.
By 90 days
Go-live date promised at day one and tracked weekly.
Every task, owner and date. No email required.
About this example
The onboarding process shown is illustrative, client names and data are never published. Your own report is built from your answers and documents, and every figure is traced back to its evidence or flagged as an assumption. Read how the method works or see pricing.